Our view of Inflation
Our “personal” CPI is a simple measurement. Each time we go grocery shopping we take the receipts and divide the total bill by the number of items. We don’t weed out taxes or deposits or anything else. This is out-of-pocket. We do note which of the local grocery stores it was from and we went back over the receipts to pull a small basket of example items to do more in-depth comparison.
By comparison, Statistics Canada (and most other nations) compile an extensive list of items (a “basket”) to represent a baseline consumer price index (CPI).
Our own data, first comparison of average price per item per month
CdnCPI <- read.csv("/home/rstudio/KitchenInflation/cg221116a001-eng.csv") # nolint
OFHKitchenPPI <- read.csv("/home/rstudio/KitchenInflation/OFHKitchenPPI.csv") # nolint
OFHKitchenPPI$Month <- month(mdy(OFHKitchenPPI$Date)) # nolint
OFHKitchenPPI$Year <-year(mdy(OFHKitchenPPI$Date)) # nolint
OFHKitBasket <- read.csv("/home/rstudio/KitchenInflation/OFHKitchenBasket.csv") # nolint

# Sum the TotalCost and NumOfItems columns by Month
TC <- aggregate(TotalCost ~ Month, data = OFHKitchenPPI, FUN = sum) # nolint
NI <- aggregate(NumOfItems ~ Month, data = OFHKitchenPPI, FUN = sum) # nolint

AvgPPIbyMonth <- merge(TC, NI, by = "Month") # nolint
AvgPPIbyMonth$AvgItemCost <- AvgPPIbyMonth$TotalCost/AvgPPIbyMonth$NumOfItems # nolint

plot(AvgPPIbyMonth$Month,AvgPPIbyMonth$AvgItemCost,type = 'p', col = "red", ylab = "Avg cost per item by month", xlab = "Month of 2022",ylim = c(4.5,6.5)) # nolint: line_length_linter, commas_linter, commas_linter.

# Fit a linear regression model
fit <- lm(AvgPPIbyMonth$AvgItemCost ~ AvgPPIbyMonth$Month,na.action = NULL) # nolint: commas_linter, line_length_linter.

# Add the regression line to the plot
abline(fit, col = "blue")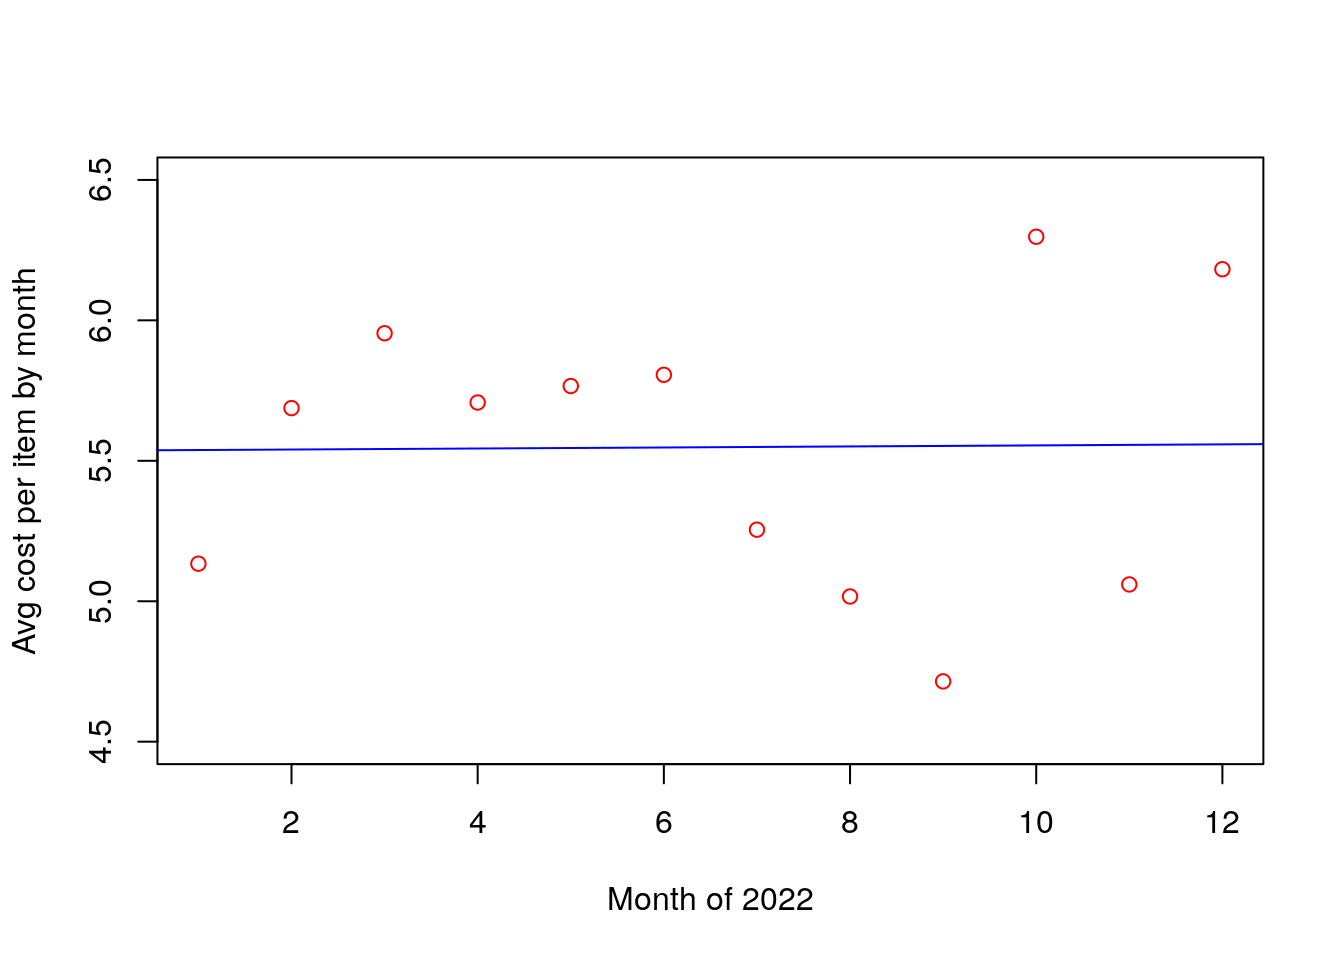
Interestingly, even with the variation from month-to-month, the average linear model over the year is surprisingly flat. The complicating factor is that as prices rise, folks will take steps to bring the bills back under control. This is exactly what we did so maybe we can tease the details out. Let’s first look at the stores purchased from over time.
#ggplot(OFHKitchenPPI, aes(x = as.Date(Date), y = TotalCost, color = as.factor(Store))) + # nolint: line_length_linter.
#  geom_point() # nolint: commented_code_linter.

Bread <- ggplot(subset(OFHKitBasket, OFHKitBasket$Item == "Bread"), aes(x = as.Date(Date), y = Price.Unit, color = as.factor(Store))) + # nolint: line_length_linter.
  geom_point() +
  geom_smooth(method = "lm", se = FALSE) +
  labs(x="Date", y = "Price per Unit",title="Bread by the loaf")
Bread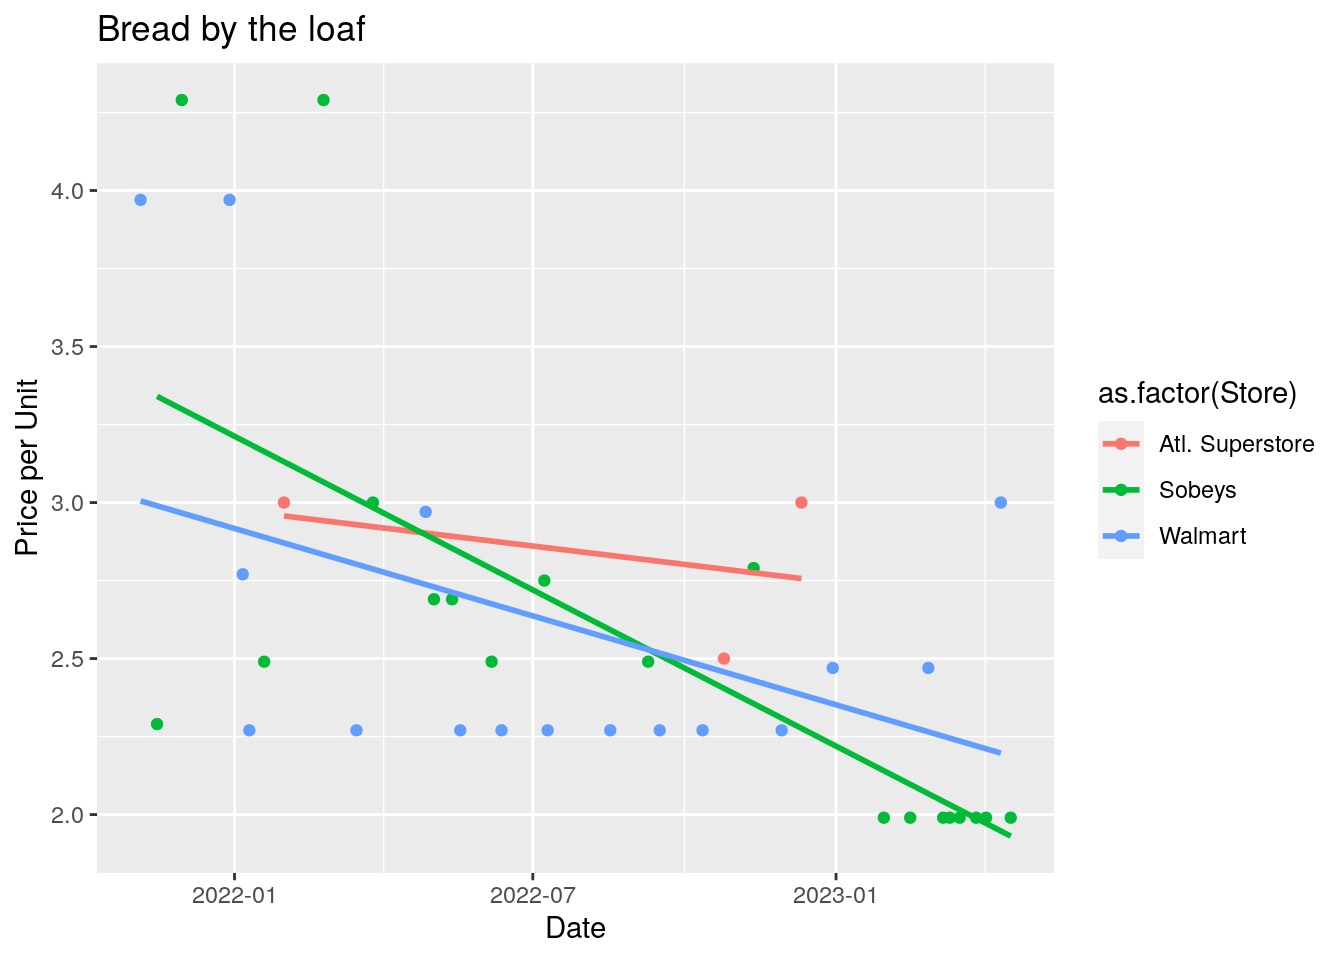
The price of bread over the time period shows a decline at all the usual stores, with a sharp decline in price at one store (Sobey’s) with the best prices toward the end of the year. It was a promotional price for loaves from their in-house bakery, which was quite good. Soon after however they switched to a loyalty card promotion and the price went up quite a bit. Coincidentally the fallout from “Breadgate” I suspect helped alleviate the increases in bread during that period as the grocery companies were under additional scrutiny. see: Canadian bread price fixing scandal
ggplot(subset(OFHKitBasket, OFHKitBasket$Item == "Milk"), aes(x = as.Date(Date), y = Price.Unit, color = Type.Size)) + # nolint: line_length_linter.
  geom_point() +
  geom_smooth(method = "lm", se = FALSE) +
  labs(x="Date", y = "Price per Unit",title="Milk by the liter") # nolint: commas_linter, line_length_linter.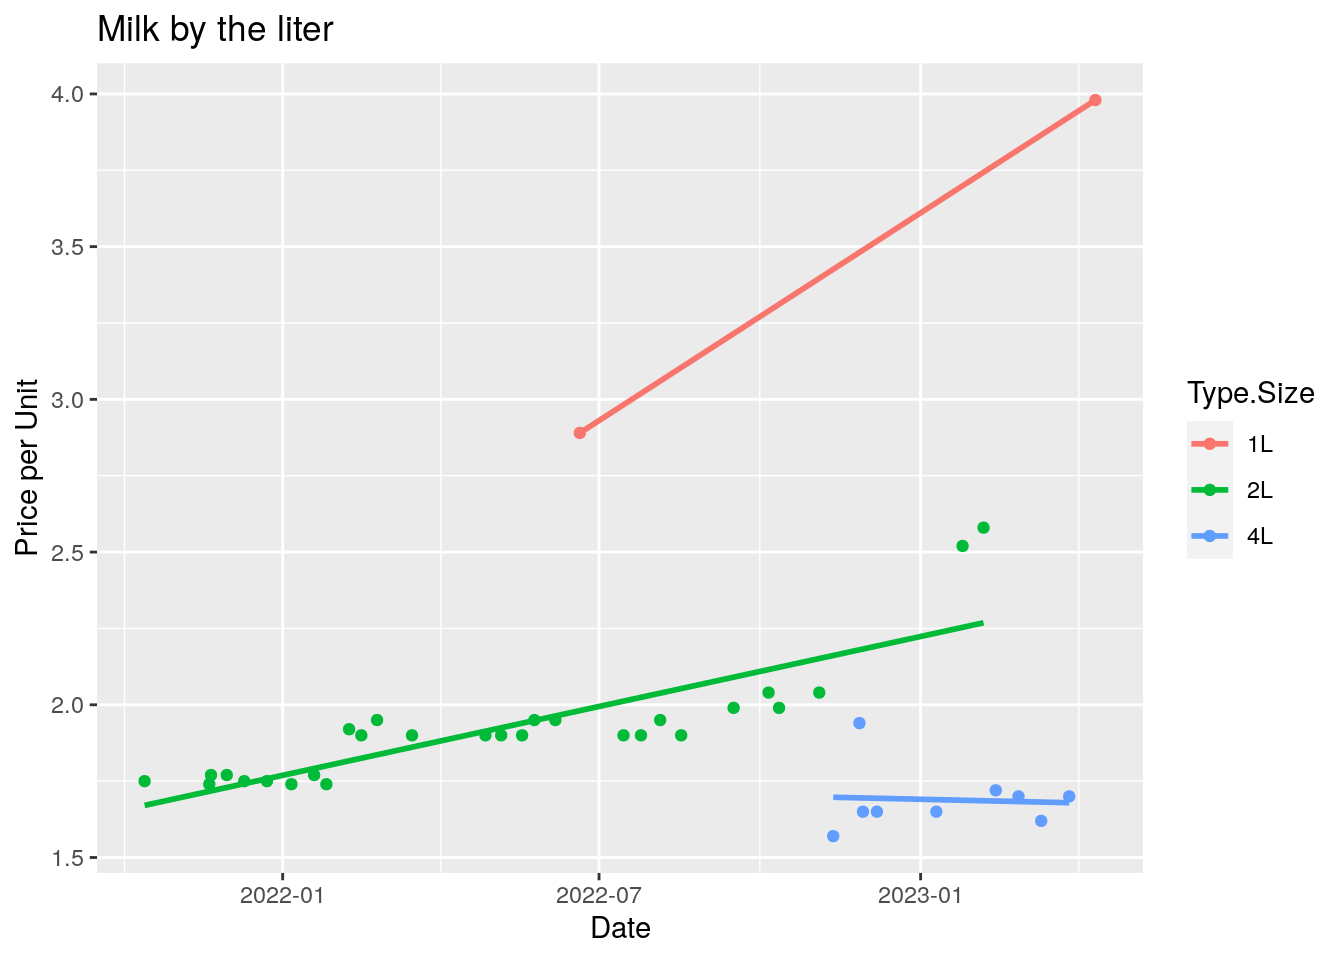
Looking at Milk didn’t indicate a large difference by store, but shows a strong difference in price/litre when we started getting it in the bigger 4L containers
ggplot(subset(OFHKitBasket, OFHKitBasket$Item == "Butter"), aes(x = as.Date(Date), y = Price.Unit, color = as.factor(Store))) + # nolint: line_length_linter.
  geom_point() +
  geom_smooth(method = "lm", se = FALSE) +
  labs(x="Date", y = "Price per Unit",title="Butter by the package") # nolint: commas_linter, line_length_linter.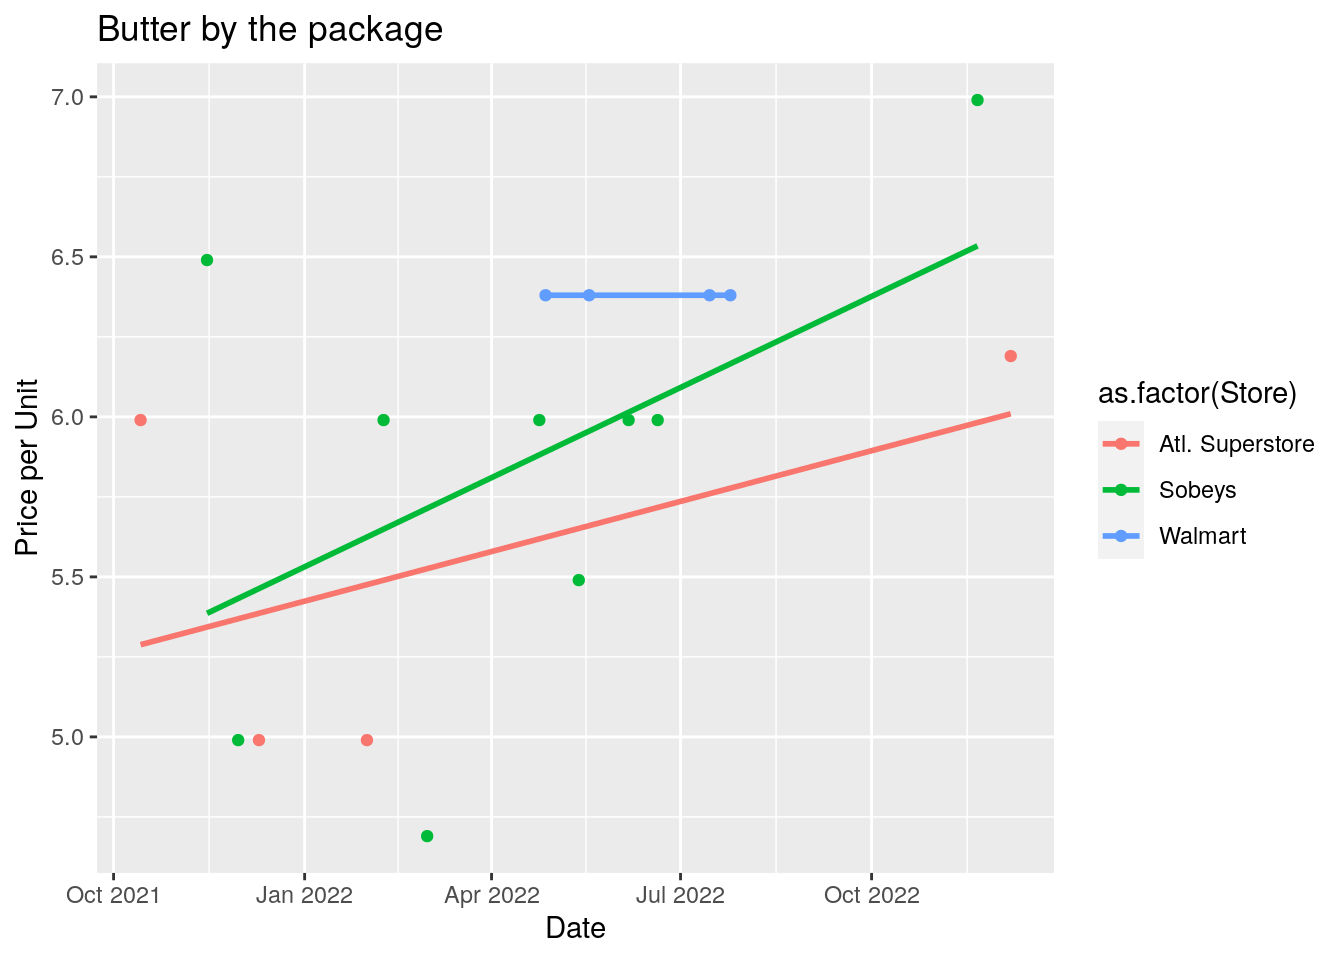
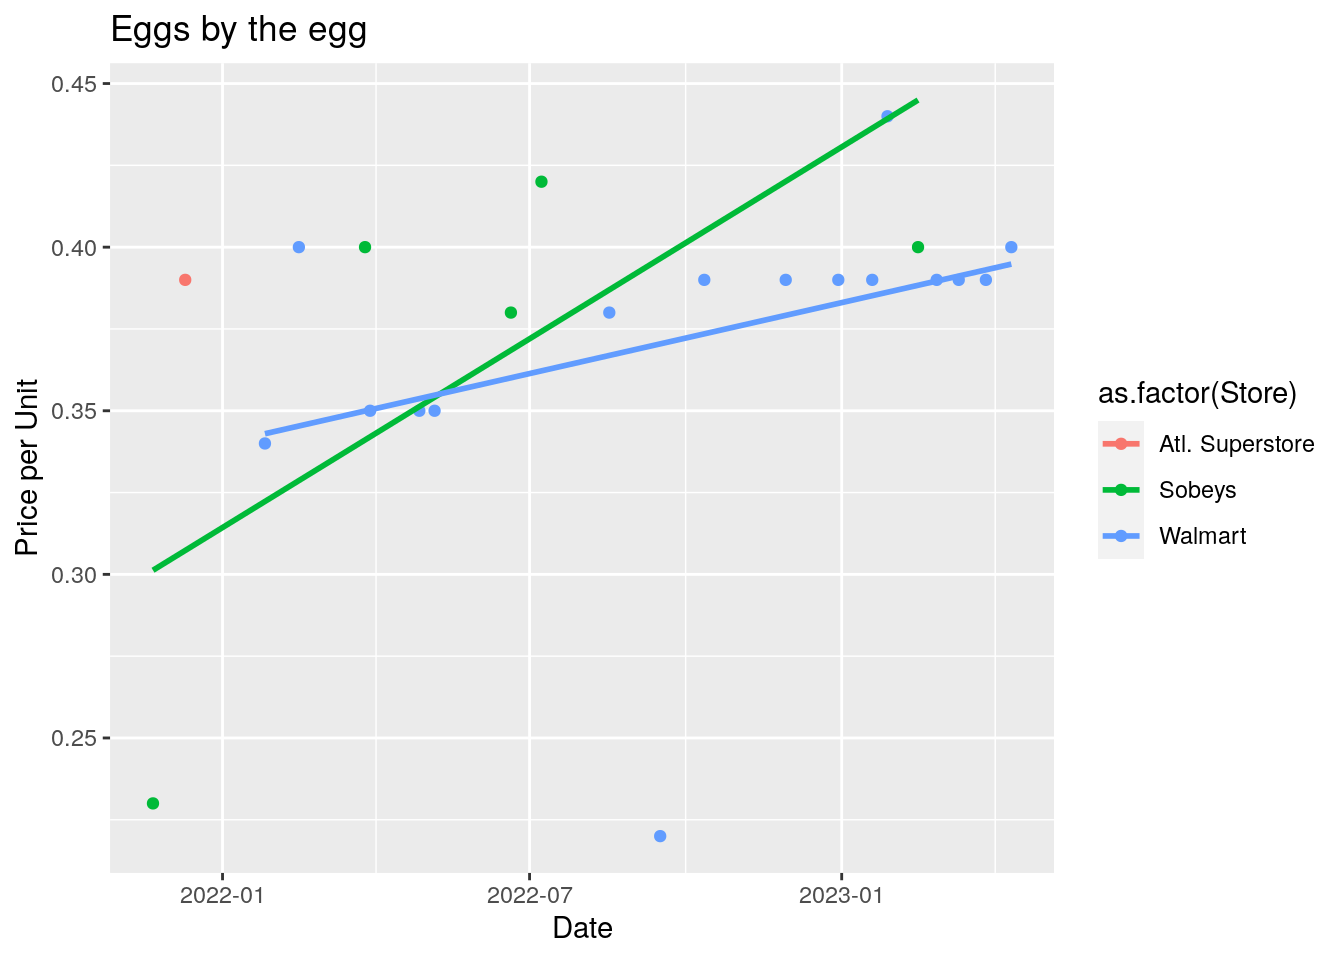
ggplot(subset(OFHKitBasket, OFHKitBasket$Item == "Eggs"), aes(x = as.Date(Date), y = Price.Unit, color = as.factor(Store))) + # nolint: line_length_linter.
  geom_point() +
  geom_smooth(method = "lm", se = FALSE) +
  labs(x="Date", y = "Price per Unit",title="Eggs by the egg")