Statistics Canada CPI
The Consumer Price Index (CPI) reflects price fluctuations experienced by Canadians by comparing the cost of a fixed selection of products over time. There are eight major categories within the CPI basket:
- Food
- Shelter
- Household operations and furnishings
- Clothing
- Transportation
- Health and personal care
- Recreation and education
- Alcoholic beverages and tobacco.
The data is available for different locations such as the national level, provinces, and select cities. This index helps monitor the economic stability in terms of consumer expenses and cost of living adjustments.
# slightly modified version of the file provided from Stats Canada's website.  The top comment line was removed to allow the csv data to more
CdnCPI <- read.csv("/home/rstudio/KitchenInflation/cg221116a001-eng.csv")
plot(as.Date(CdnCPI$Date),CdnCPI$CPI,type = 'l', col = "red", ylab = "CPI and CPI minus volatiles", xlab = "Date")
lines(as.Date(CdnCPI$Date),CdnCPI$CPI.excluding.food.and.energy,type = 'l', col = "orange")
legend("topleft", bty = "n",legend = c("CPI", "CPI minus volatiles"), col = c("red", "orange"), lty = 1)
title("CPI and CPI minus food and energy")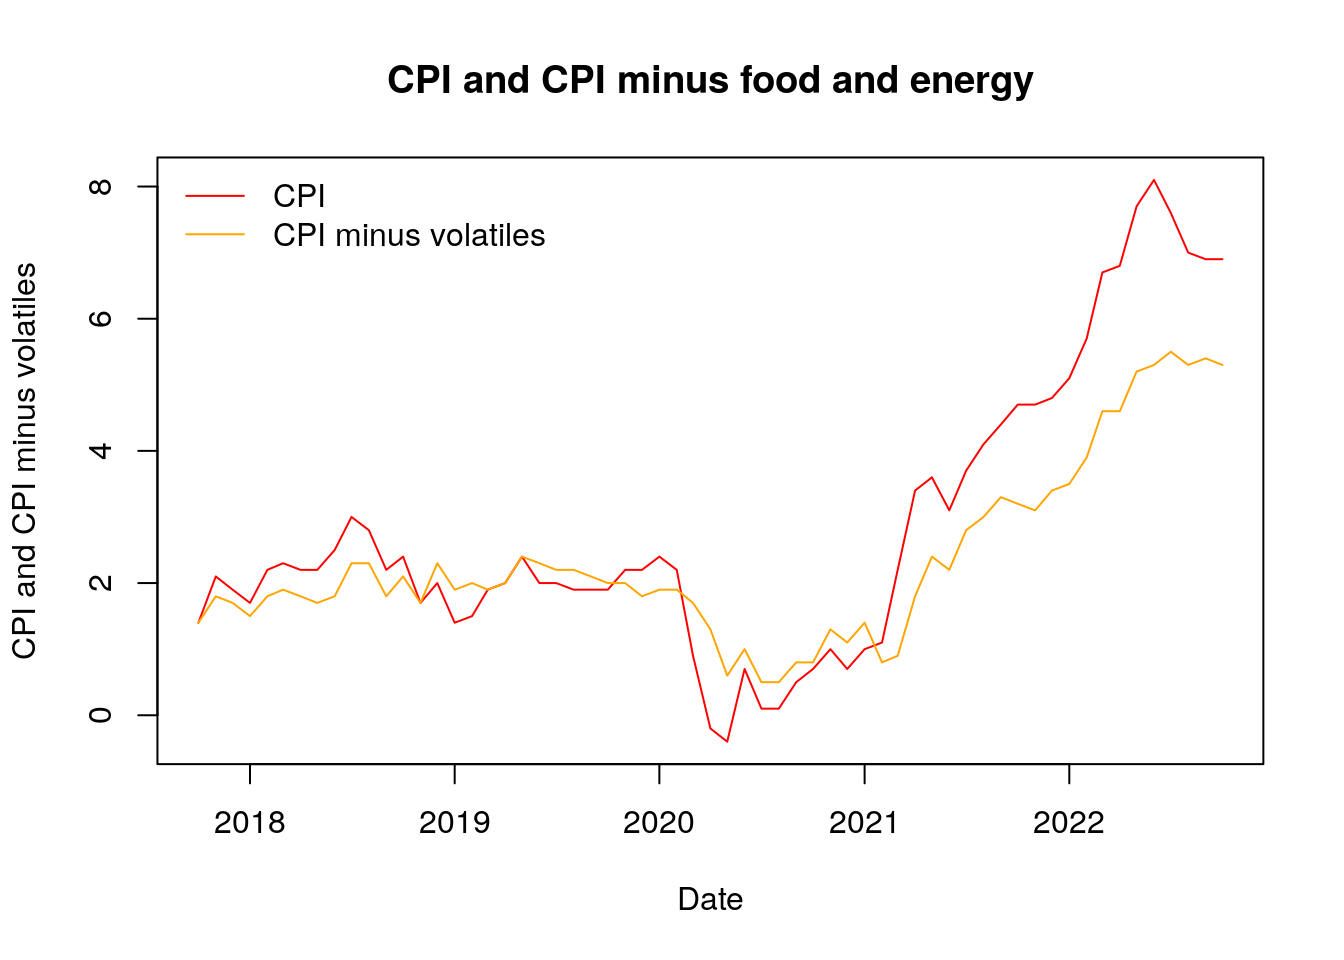
CdnCPI2022 <- filter(CdnCPI,year(as.Date(CdnCPI$Date)) == 2022)
plot(as.Date(CdnCPI2022$Date),CdnCPI2022$CPI,type = 'l', col = "red", ylab = "CPI and CPI minus volatiles", xlab = "2022")
lines(as.Date(CdnCPI2022$Date),CdnCPI2022$CPI.excluding.food.and.energy,type = 'l', col = "orange")
legend("topleft", bty = "n",legend = c("CPI", "CPI minus volatiles"), col = c("red", "orange"), lty = 1)
title("CPI and CPI minus food and energy")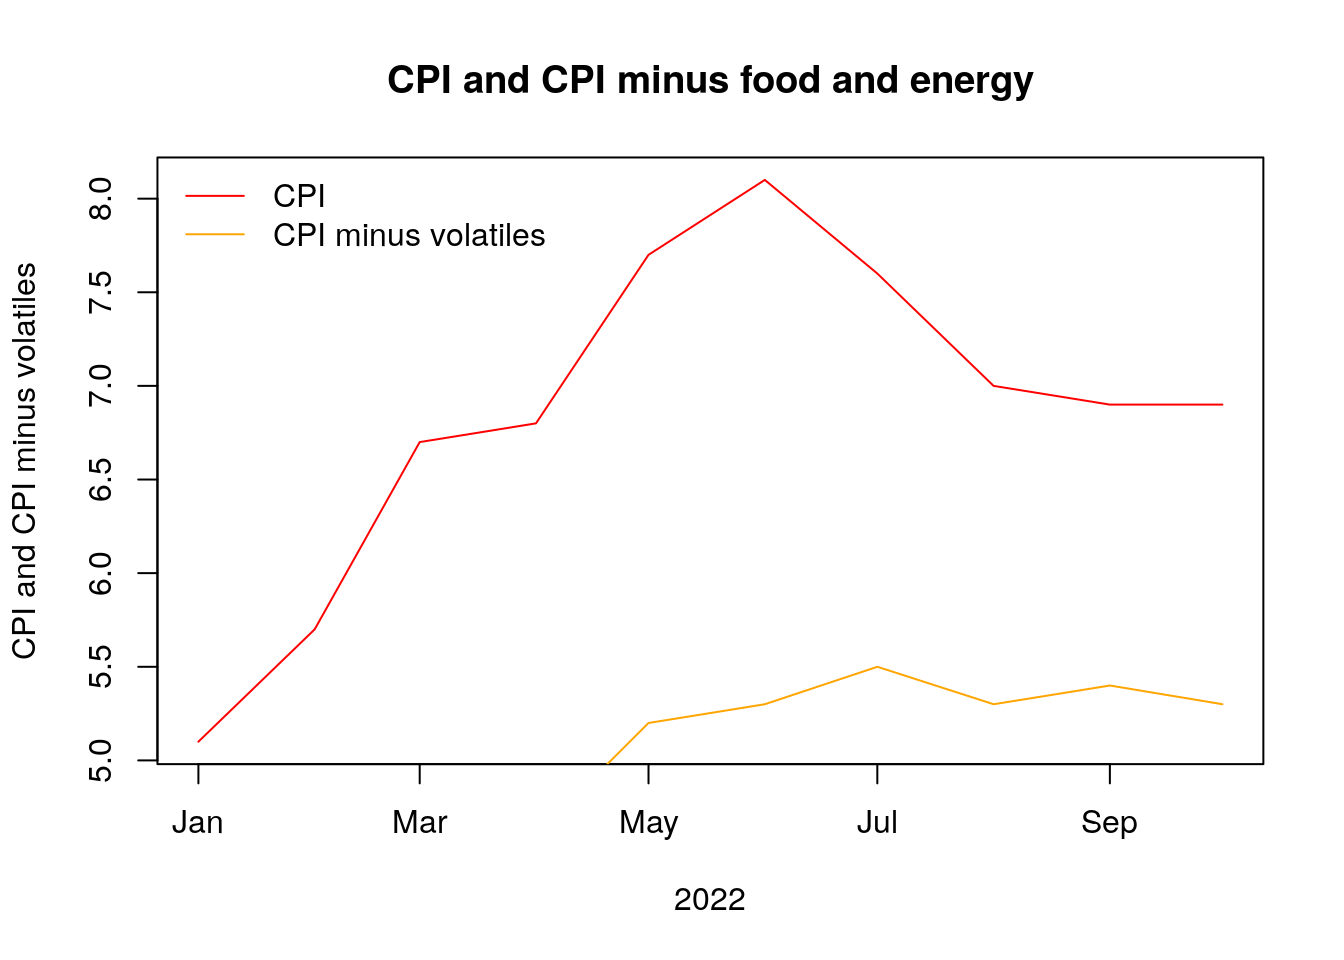
Government of Canada, Statistics Canada. “Exploring the First Century of Canada’s Consumer Price Index,” February 6, 2015. https://www150.statcan.gc.ca/n1/pub/62-604-x/62-604-x2015001-eng.htm.↩︎